Scout's top-secret 4-point observability plan
Observability: the degree to which you can ask new questions of your system without having to ship new code or gather new data.
Above is my slightly modified definition of observability, mostly stolen from Charity Majors in Observability: A Manifesto.
Observability is increasingly important. Modern apps and services are more resilient and fail in soft, unpredictable ways. These failures are too far on the edges to appear in charts. For example, an app may perform dramatically worse for one specific user that happens to have a lot of associated database records. This would be hard to identify on a response time chart for apps doing reasonable throughput.
However, understanding observability is increasingly confusing. Sometimes observability appears an equation: observability = metrics + logging + tracing. If a vendor does those three things in a single product, they've made your system observable.
If observability is just metrics, logging, and tracing, that's like saying usability for a modern app is composed of a mobile app, a responsive web app, and an API. Authorize.net has those things. So does Stripe. One is clearly more usable than the other.
I think it's more valuable to think about how your existing monitoring tools can be adapted to ask more questions. There's significant room for this in standalone metrics, logging, and tracing tools.
At Scout, we've been thinking about how we can help folks ask more performance-related questions about their apps. We're not building a custom metrics ingestion system. We're not adding a structured logging service. We're focusing on our slice of the world.
Below I'll share our top-secret observability plan.
The problem with APM and observability: taste
In the first episode of Abstract, Christoph Niemann shares how he expresses love in an illustration. You could go really raw - a bleeding, pumping heart - but that's not very romantic. You could go abstract - just a red square box - but that could represent many things. In the end, expressing love via an illustration is somewhere in the middle:
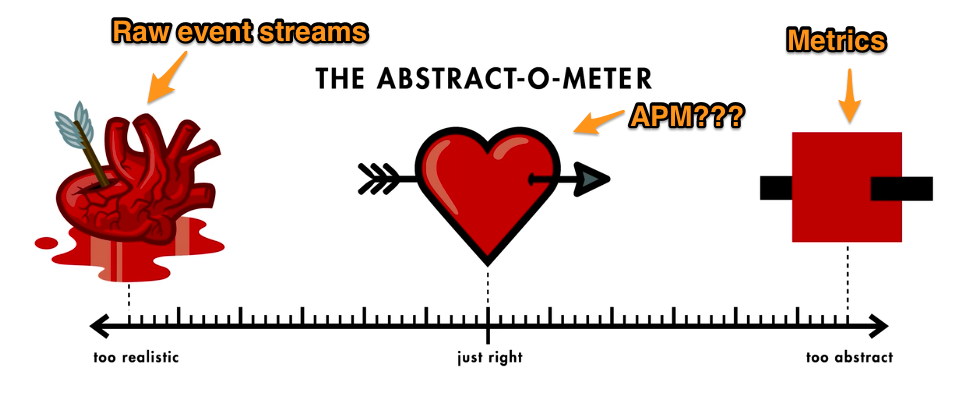
This is the observability challenge for an Application Performance Management (APM) service like Scout. The special sauce of APM is a monitoring agent that is deeply embedded in the application code. This is required to provide actionable insights, typically via transaction traces. An APM service shouldn't be the bleeding heart - that's better served by dedicated services that handle raw, structured, query-able events. While Scout does provide some pre-aggregated performance metrics, an APM service shouldn't devolve into a dashboard-heavy experience. That takes you further away from transaction traces.
An APM product falls somewhere in the middle of the observability spectrum, and that's a challenge: it involves taste and trade-offs. The middle means compromise.
4 ways we're increasing observability at Scout
Our monitoring agent - like every other APM agent - is deeply embedded in the application code. This gives unique insights - like backtraces to slow method calls - that don't easily fit into other types of monitoring systems. At Scout, we think it's important to leverage the benefits of an embedded agent to ask more questions and get back more actionable answers:
There are four areas that APM tools are uniquely qualified to help with observability:
- Production-Safe Profiling: finding the unknown-unknown performance bottlenecks
- Trace Exploration: Real-time filtering+querying transaction traces
- On demand Production Tracing: Collect a transaction trace at anytime
- DRY-ing performance data - make complimentary metrics and logging systems better by fanning out performance data
1. Production-Safe Profiling
The problem
Nearly half of the time in transaction traces across languages (be it Ruby, Elixir, or Python) falls outside of the libraries APM tools auto-instrument. It's frequently custom code written by your development team. This is a significant unknown-unknown. Wrapping your code in custom instrumentation, deploying, and repeating is cumbersome and prone to errors.
What Scout has done so far
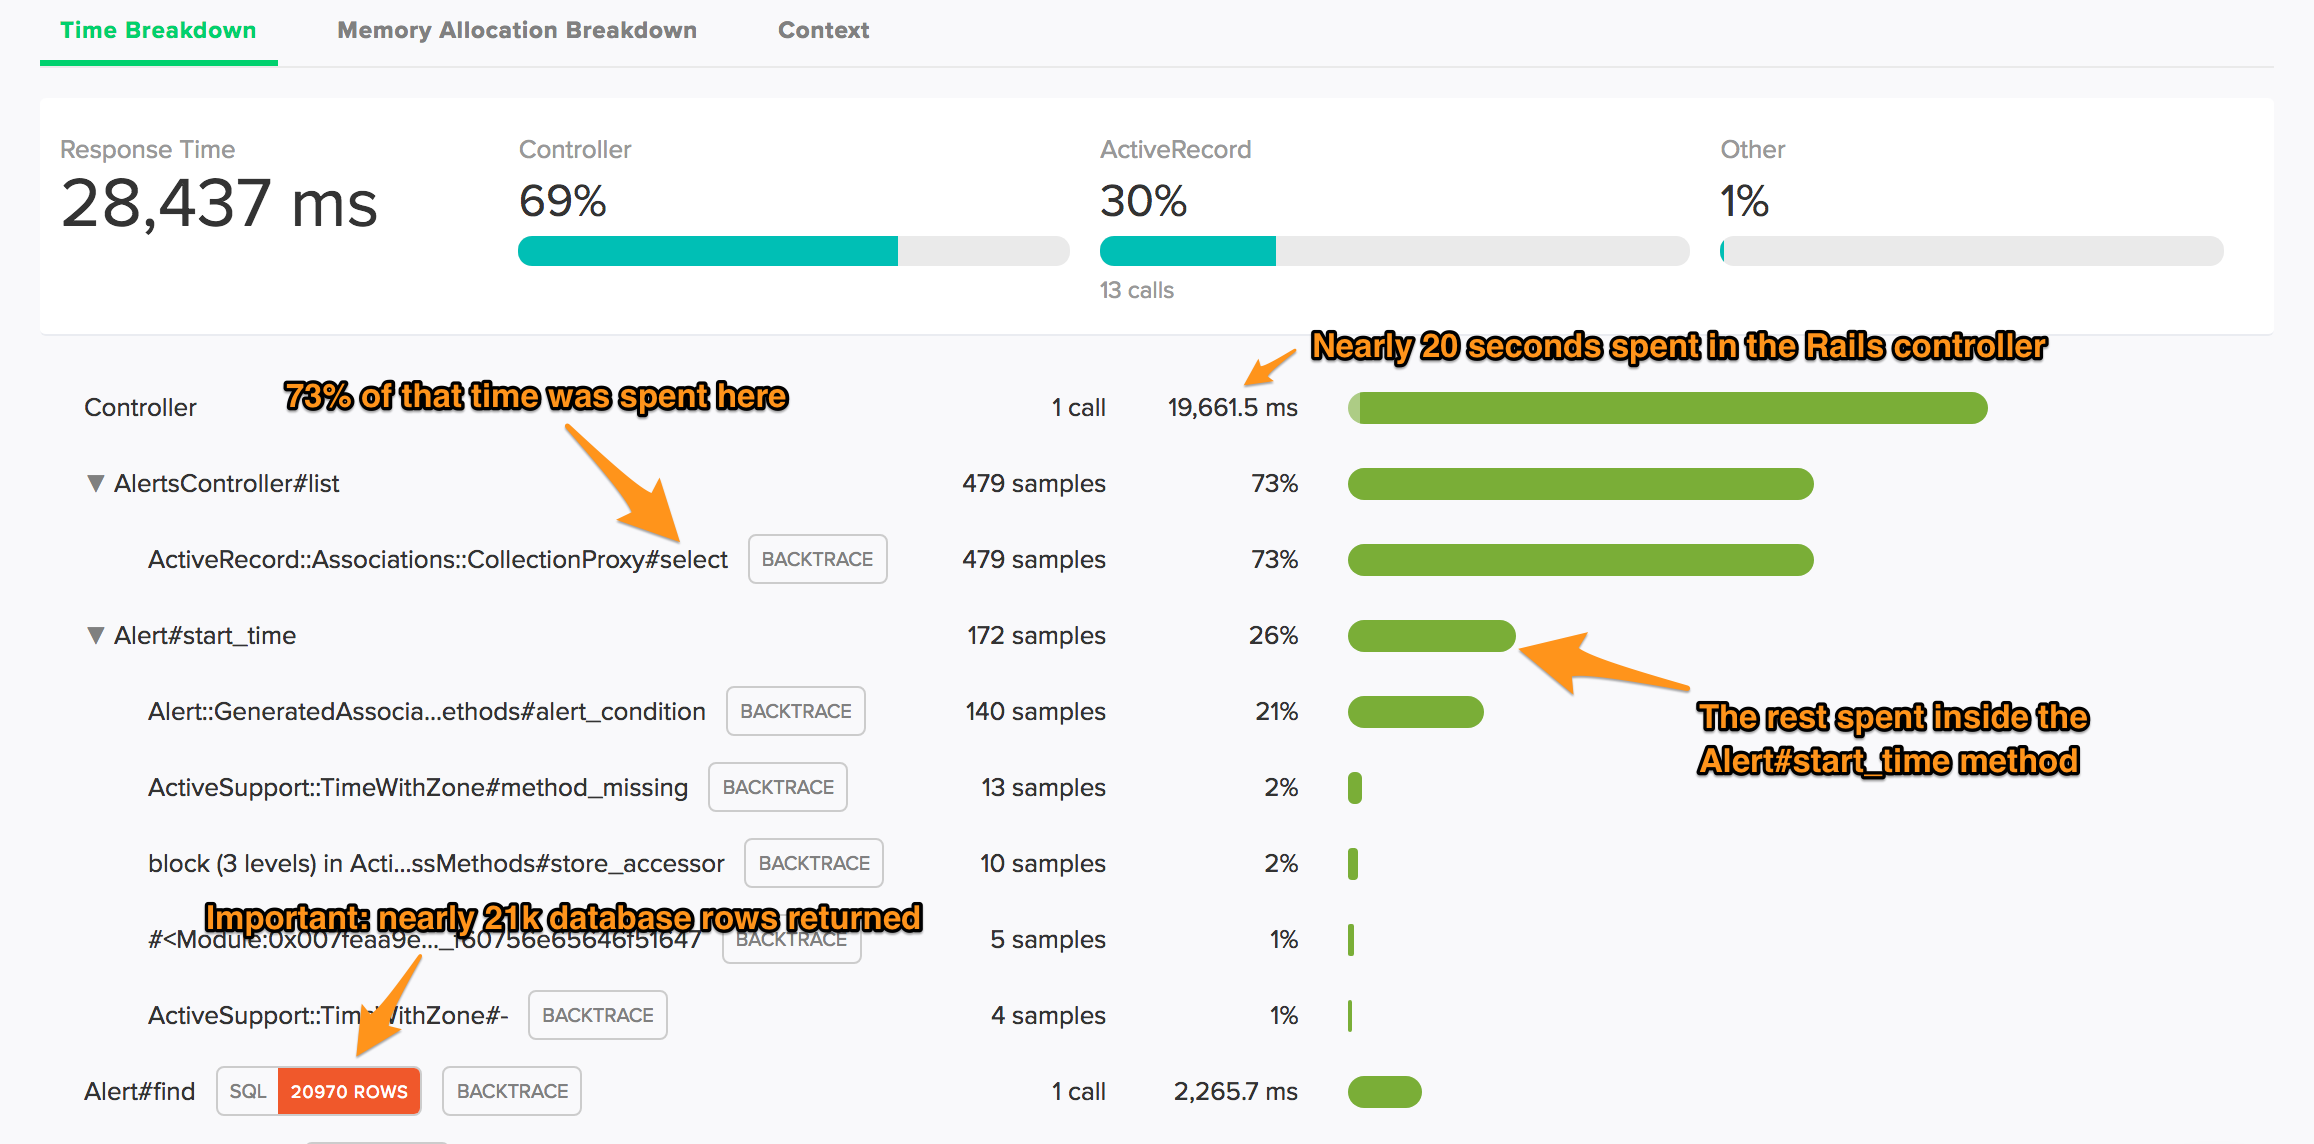
A BETA version of our Ruby agent includes an embedded sampling profiler, ScoutProf. ScoutProf profiles code that falls outside our default instrumentation. It filters out framework code you are unlikely to modify, focusing on just the code you've written. This breakdown appears right inside transaction traces:
That said, there are the expected BETA-ish issues:
- We're only profiling the "controller" portion of Rails web requests. No background jobs, views, etc. No support for other languages.
- Sometimes - although rarely - it crashes.
- Sometimes we get far fewer samples than we'd expect.
What we're planning at Scout
Opensource ScoutProf - make it a standalone Ruby gem - so anyone can more easily profile blocks of code. Viewing the data within Scout will be one of the available output formats. Increasing the usage of ScoutProf will help solve the funky profiling edge cases that exist and harden the library.
After that, we're going to do the same for the other languages we support. This isn't a Ruby-specific problem.
2. Trace Exploration
The problem
A transaction trace is an incredibly well-structured, context-rich event that breaks down the performance of method calls across the request lifecycle.
To date, it's been a challenge to ask questions about this data. In many services, you simply can't query and filter transaction traces. You can in others, but the experience is slow, requiring a back-and-forth process of changing filters and hitting a "Query" button. You have to some idea of what you are looking for, but many times you just don't know - you are exploring.
Searching through transaction traces today is like trying to search for a hotel room when you don't know the dates of travel, the city, or your budget.
What Scout has done so far
Not much :).
What we're planning at Scout
Inspired by Crossfilter, we're developing a UI that lets you filter transaction traces in realtime. You can filter on one dimension (like response time) and instantly see which other dimensions are composed in it. For example, you could select just your slowest traces and see if those are only experienced by certain users, IPs, or database shards, or hostnames.

3. On demand Production Tracing
The problem
Many issues don't reveal themselves until they reach production. It should be possible to inspect the performance of a request you just experienced in the browser. Without this, you don't know if you can ask any questions because the trace may not exist.
What Scout has done so far
We've built a local-only in-browser profiler called DevTrace and Ruby and Elixir libraries for sending down summary performance metrics in production via the server timing API. Both of these are helpful, but DevTrace is local-only and the server timing API just provides a summary. There's no ability to dig into details.
What we're planning at Scout
We're working on an approach to give access to instant server-side traces as an authorized user browses an application. Traces will be accessible from your in-browser developer tooling (ex: Chrome Dev Tools). This will be production-safe and bypass all of the hairy Javascript code required for DevTrace.
4. DRY-ing performance data
The problem
An APM agent collects the richest dataset of any embeddable monitoring library because it needs to generate detailed, actionable transaction traces. Transaction traces are why you use an APM service like Scout!
That said, it's common to use another library to export request durations, error throughput, and total throughput to a system like Prometheus and another library to generate query-able, structured logs of request events and their timing breakdown.
You shouldn't have to install multiple libraries that all add instrumentation, but just report the data in different formats. You lose a single source-of-truth for performance data, instrumentation can be brittle and break as you upgrade, and instrumenting your app in 3 ways increases the performance overhead.
What Scout has done so far
Not much :).
What we're planning at Scout
Open-source our language instrumentation (we've done this with Python) and create a pluggable-system to fanout data to other services. You'll gain access to the raw event data to perform operations as you wish.
TL;DR
Observability doesn't mean bundling metrics, logging, and traces in a single tool and calling it done. Observability is the degree to which you can easily ask questions and get great answers. There's fertile ground to ask more questions for each type of monitoring tool, Scout and APM included.


