A 5-point Rails app performance audit

Before we talk performance, let’s talk entropy. Entropy refers to the idea that everything in the universe eventually moves from order to disorder and entropy is the measurement of that change.
Just like entropy, the performance of a Rails app will trend towards disorder. An N+1 database query here, a forgotten pagination implementation there, a missing index here, etc. This performance debt builds over time, and suddenly, we’ve got a slow app.

Where do you start knocking down this performance debt? Surely, not everything is slow, right? Let’s perform a Rails performance audit. In 10 minutes or less, you’ll have a good idea of where your Rails app stands, and where to focus your efforts by following this 5-point performance audit. At each step of the audit, I’ll work through the analysis on a real production app so you can see an audit applied.
Feel free to use the following links to navigate around the post:
Carry out a general profile of your Rails App
Check for backed up requests in the queue
Monitor how fast are response times
Analyze the spread of speed in response times
Check the amount of traffic the app is handling
Rails Performance Best Practices
Without further ado, let’s dive into the process!
1. Carry out a general profile of your Rails App
It goes without saying that pinpointing the issue always begins with a bird’s eye view of the entire situation. The best place, to begin with, is by taking a general look at the response times of your Rails application. Response times signify how fast your server is able to respond to your users’ requests. The lesser the response time, the better is the user experience. Nearly all application performance monitoring platforms feature a dedicated metric on response times.
If you’re using Scout, response times are the topmost metric when you’re viewing your application. For better results, change the time frame to 7 days instead of the default time frame. This helps as many apps have seasonal trends - like higher throughput during the business day - and the longer timeframe will reveal the general profile of the app.
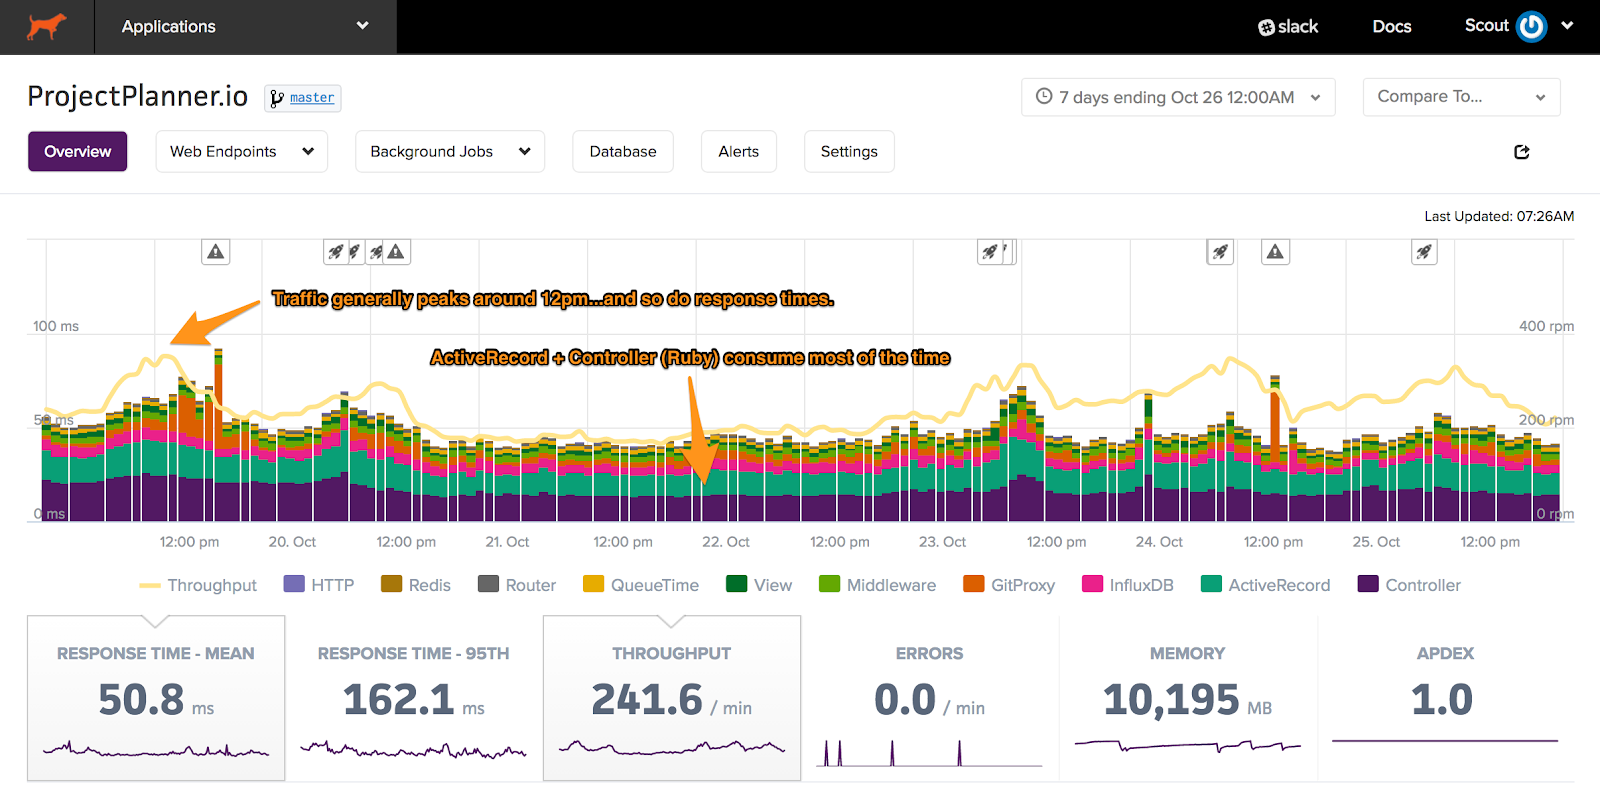
Each element of the stacked bar represents a layer of your stack (ex: database, external HTTP calls, Ruby). Added together, this displays the average response time across all requests to the app.
How does the example app look?
Pretty good! This is likely an app used during the business day as traffic and response times peak around noon. While response times increase from 40 ms to 70 ms during these peak periods, we can't yet conclude there is a scaling problem: customers may be using heavier controller-actions that aren't used during off periods. Let's note this and dig in later.
2. Check for backed up requests in the queue
Once you have an idea of a general profile of your application, the first thing that you should check for is if there are any backed up requests in your application’s queue. This can be a major factor affecting the performance of your web application.
To analyze this, you need to look for a QueueTime metric. In a general sense, this metric describes the time spent between the moment a request hits a load balancer till when it is first processed by your application server. You might want to go through your APM’s terminologies to find out the metric that measures this data. In the case of Scout, QueueTime is the way to go.
Here’s where you can find the QueueTime metric for our example app in Scout:

You'll want this value to remain under 20 ms. If this exceeds 20 ms, you have a capacity issue somewhere in your stack (most commonly at the app server or database).
How does the example app look?
ActiveRecord (database) and Controller (Ruby) account for most of the time spent. This is great: it drastically reduces the number of possible layers that need attention. Queue times in our case are generally 2 ms or less - it's unlikely we have a capacity problem.
3. Monitor how fast are response times
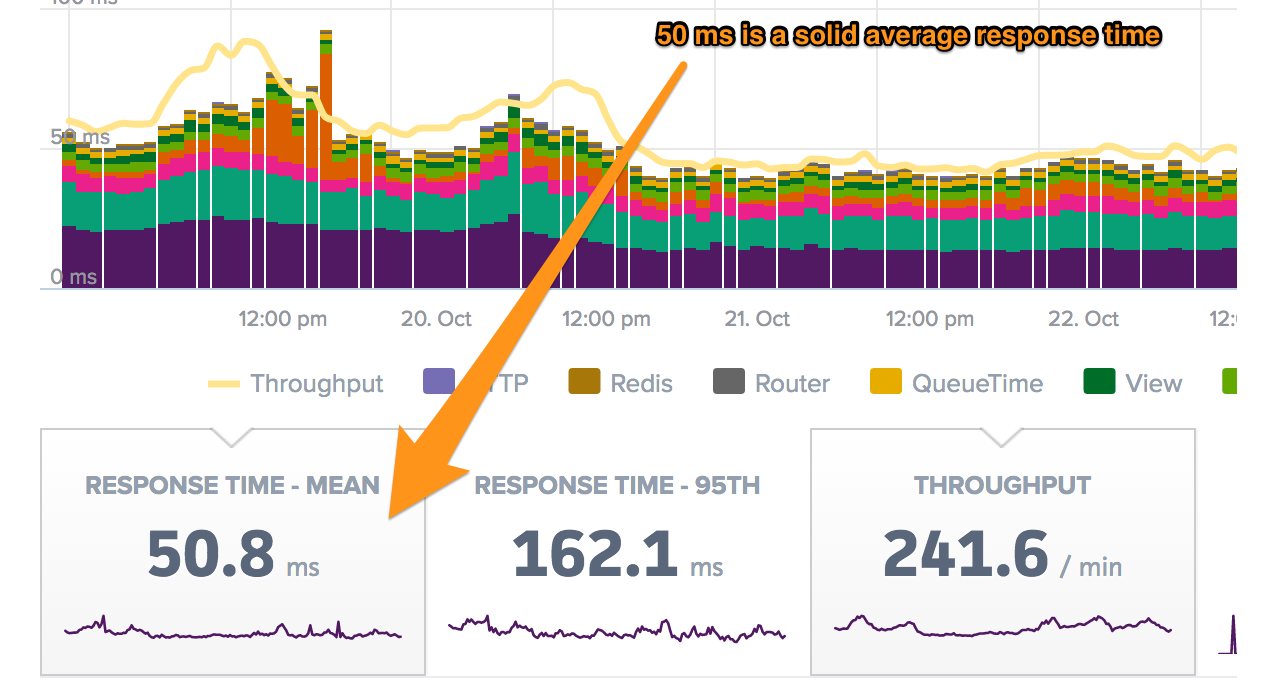
Having gained significant insight into our Rails app performance, we should now take a look at the response time numbers and determine how much trouble we’re in. As we’ve already seen, response times are directly related to better user experience, so it’s important to ensure that we’re never cutting short on them. But it can become confusing at times to determine how to gauge response times correctly. A good way to begin is to analyze the mean response time of the Rails application. The mean response time refers to how long it takes for an average request originating from a user to be served by your application. An important thing to note here is that EVERY request in the set time frame has been used to calculate the mean. This means that it also includes the infrequent super slow requests that occasionally happen due to factors such as network latency and platform issues.
In Scout, you can find the mean response time beneath the time-series chart:
Here are a few rules of thumb for response times:
|
Requests per minute |
Classification |
|
< 50 ms |
Fast |
|
< 300 ms |
Normal |
|
> 300 ms |
Slow |
If you're just serving JSON content for an API server, response times should be smaller...perhaps 100 ms is slow in your case.
How does the example app look?
Response times are fast...but, the mean response time doesn’t tell the whole story. Let’s take in another metric to get a better idea of the performance.
4. Analyze the spread of speed in response times
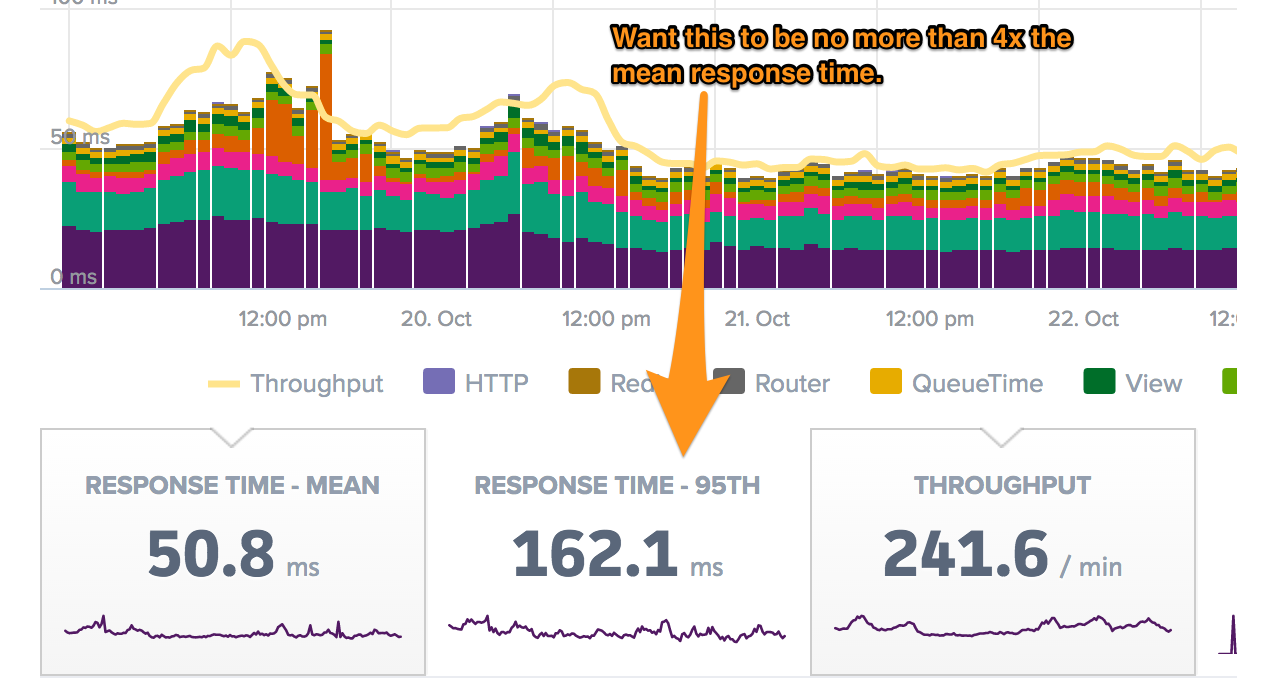
While mean gives a fair take on the performance of the application, it is not really practical. This is because a single, fast, high-throughput controller action can drastically reduce an app’s mean response time. A good metric to refer to, in order to remove such edge cases, is the 95th percentile response time. 95th percentile response time shows the response time for 95% of the requests. Conversely, 5% of response times are above the value of this metric. You’ll want the 95th percentile response time to be no greater than 4 times the mean response time. If it’s greater than that, then your app might have some controller-actions triggering significantly longer response times.
In Scout, you can find the 95th percentile response time here:
How does the example app look?
The 95th percentile response time (162 ms) is 3.2x greater than the mean response time (51 ms). This falls within the 4:1 ratio, but it's close enough to the max that there may be some slow controller-actions within the app.
5. Check the amount of traffic the app is handling
As evident as it can be, the greater the throughput, the more difficult it becomes to optimize performance. With the growth in throughput, the underlying services become more and more complex, and there are more business trade-offs to consider when doing performance optimization. This largely affects how we carry out optimization and is a crucial step before you actually get down to making improvements in your Rails application. Some typical scenarios include what to do when an endpoint is slow for a single, high-paying customer, or what to do when a less significant endpoint is slow for a great number of users, etc.
Here’s a rough table you can refer to in order to understand how large your application is, and how careful you’ve to be while making ground-breaking changes -
|
Requests per minute |
Scale |
|
< 50 rpm |
Small |
|
50 - 500 rpm |
Average |
|
500+ rpm |
Large |
How does the example app look?
Our mean throughput is 240 rpm with spikes up to 350 rpm. This is an average application in terms of throughput. There's likely a decent number of knobs we can turn.
Rails Performance Cheatsheet
After having gone through the audit process in details, here’s a quick, concise cheat sheet for you to carry out preliminary checks on your Rails application -
- What's the general performance profile of the app? Are there clear busy periods during the day? Does the app get dramatically slower during peak times?
- How well does your app handle requests? There's likely just a couple of dominant pieces (example: Ruby & ActiveRecord). Are there periods where QueueTime exceeds 20 ms, indicating a capacity problem?
- Is your app fast (< 50 ms response times), average (< 300 ms response times), or slow (> 300 ms response times)?
- Are 95th percentile response times no greater than 4x the mean response time? If not, there may be some pokey slowness even if response times are generally fine.
- Is your app small (< 50 rpm), medium (50 - 500 rpm), or large (500+ rpm)? The larger the app, the more delicate performance improvements become.
Rails Performance Best Practices
Once you’ve done an audit on the performance of your Rails application, the next steps obviously include fixing the issues. Here are a few best practices you can follow the next time you’re either building or working to improve a Rails application -
Choose a proper hosting provider
One of the fundamental decisions that you need to make very early in your Rails app deployment is to find the right hosting provider. It is important to know your requirements. Cloud service providers like AWS, Google Cloud, etc are a good alternative when you’re looking for maximum control, but they come with a manual setup overhead. On the other hand, providers like Heroku make setup super simple but reduce the amount of control you have over your app servers.
Use a content delivery network
If your application has a global audience, your hosting might be cutting down on your app’s performance in certain regions of the world. Use a CDN to improve your application’s availability across the globe, and make it equally faster for everybody to load and use your application.
Eliminate the N+1 query problem
N+1 query refers to the cases in which a single line of code results in way more database queries than expected. With time, this only compounds in a growing project. More on how to identify and fix them here.
Upgrade your Ruby version
The Ruby team keeps improving the framework’s performance constantly. A newer version means a more improved framework, which might automatically solve some of your performance issues.
Leverage Ruby Caching
Several caching techniques can be applied to improve Rails performance. But in general, caching will help you store the files generated during a typical response and reuse it when similar requests are received again. You can read more about it in this official, detailed guide.
Add indices to your database
Another small tweak you can do to improve your Rails app performance is to make sure that with growing size, your database isn’t turning out to be the bottleneck. Indices are a way to look up records faster, and these are a must to have in tables that have a huge number of records.
With these best practices in place, your Rails app is bound to perform better than before. You also need to keep in mind that performance optimization is a long, ever-going process that needs to be dealt with patience and perseverance. There always will be something that can be done better to hit better figures in the performance charts. While there can be no sure-shot guide to it, this post can be a good point, to begin with.